

Your contact center is the heart of your organization’s customer experience. So when it comes to evaluating your team’s performance and your organization’s overall CX health, you can’t afford to miss any signals.
But sometimes one source doesn’t tell the whole story—sentiment ratings and FCR are high, so why isn’t CSAT higher? And sometimes, customers are unsatisfied for underlying reasons that you can’t easily see, or for reasons related to internal operational issues that they aren’t aware of.
With a holistic approach, combining voice of the customer (VOC) direct feedback with the right operational metrics, you can triangulate and contextualize customer experience and get the full picture of both your contact center performance KPIs, and CX across all customer touchpoints.
Why include operational data
While direct customer feedback is vital, as detailed in Four Things Only Direct Feedback Can Provide, customers can only tell us so much about their experience.
They can tell us what they feel, what they experienced. Maybe what they’ll do next. But they can’t tell you everything about what led to them having that experience, nor what impact their experience will have on the organization—and if they try, they’re only guessing.
Here, operational data plays a major role.
Operational data provides necessary context around why customers are having the experiences that they are having. That added context delivers many benefits, including an enhanced ability to connect to the right root cause and next best action for both the customer and the organization.
The Sherlock Holmes approach to asking for operational metrics
Getting access to the kind of operational data that will help you contextualize VOC starts with knowing whom to ask, and what to ask for.
We suggest that you think like a sleuth attempting to solve the mystery of your organization’s CX and be sure to cover the following questions:
- Who: Find out who owns the operational data and who should be engaged in the process of identifying, evaluating, and providing access to operational data sources
- How/Where/When: Ask how data is captured, where it’s stored, and how often it’s updated
- What: Engage in data discovery and create a data inventory (more on this below)
Once you understand the scope of data available, establish a pattern of data sharing among key teams, including access to regularly published data and reports. It’s best if you can receive complete contact files in a sample feed, but you can also append it later.
The NICE Experience Consulting team can provide expert guidance that will accelerate the unification of direct, indirect, and operational feedback in your organization—and help you to create frictionless experiences that differentiate your brand.
Data Discovery: key questions to ask
Consider this: if you’re measuring NPS, you should want to know as much as possible about who the detractor customers are, such as: Are they from a particular segment? A particular geo? Did their experiences follow a common journey?
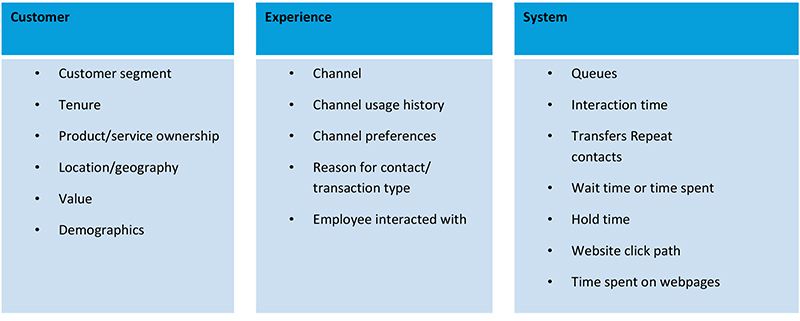
Here are some of the key questions to ask your operations team in order to understand the scope of data that is being captured across your organization, so you can access the type of data that will provide context to direct customer feedback and help you evaluate your organization’s state of CX.
Customer Profile
- What information does your organization have about customers?
- Does your organization have customer segments and multiple buyer personas? (Ask Marketing/Marketing Ops)
- What are important factors about your customers for which experiences should be explored?
Systems & Experience data
- What do your organization’s systems capture about experiences?
- Important for interaction touchpoint surveys: What was ordered? What systems were involved in processing the order?
- What channel experience details are available?
- Channel(s) used, path, time, employee interactions
- What other experience details does your contact center capture?
- Was customer put on hold? For how long? Interaction time? Number of transfers?
Great-fitting operational data
While not an all-inclusive list, here are some specific types of operational data that you can infuse into your reporting to add much-needed context to direct customer feedback and deliver deeper insights into why customers are experiencing what they are:
Again, the NICE Experience Consulting team can provide a comprehensive list of data that peer organizations have used to gain a holistic view of CX, better understand why some customers are unhappy—and determine what steps to take to remedy the situation.
Operational data requirements
Not all operational data is created equal. Perhaps that’s why, according to Aberdeen’s CX Executive Agenda 2021 survey, 78% of contact centers struggle to use the data they collect effectively.
For accurate analysis, you need to ensure that the data you’re working with has the following characteristics:
- Unique customer identifier – So you can track CX across a specific customer journey and append all related data and link it to a specific customer. This is a key requirement.
- Complete – There is a need to have the data point across a statistically significant number of customers, ideally all of them, so that related insights will be accurate and universal, i.e., if you’re analyzing the impact of hold time on CSAT, you need data on both hold times and CSAT for most/all customers.
- High-quality
- Accurately captured
- Regular cadence for updating, system generated
- Confidence in the source
- Future-proof, forward-looking – Consider data that may not be related to current goals, but could be helpful in the future.
Use case: Helping a bank set SLAs
The NICE team worked with a large banking client who collected data on overall satisfaction as part of their VOC survey. They also collected data on interaction time—how long transactions take.
By combining and analyzing that data, the NICE team was able to help the bank establish ideal service levels for interacting with customers.
Break Point Analysis: CSAT vs. Interaction Time
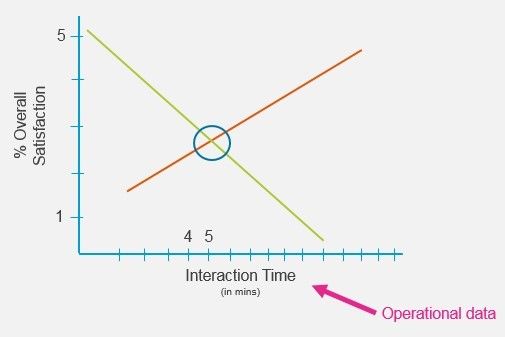
The combination of VOC data and operational data showed that CSAT would drop significantly at a certain point in time: once interaction times were over 5 minutes, customers reported that they were dissatisfied—dissatisfied to the point where it would trigger an alert that follow up was required. So the team was able to set an SLA based on that break point.
This example of marrying CSAT data and interaction time could be applied directly in a contact center, where you would certainly have data on call times. It’s an easy way to combine two data points and deliver immediate value and business impact.
Use case: NPS scores by segment/geography at an insurance company
In this example, an insurance company provided the NICE Experience Consulting team data on the type of insurance a customer purchased (by customer segment), customer location, and customer NPS.
Key NPS Segments by Geo
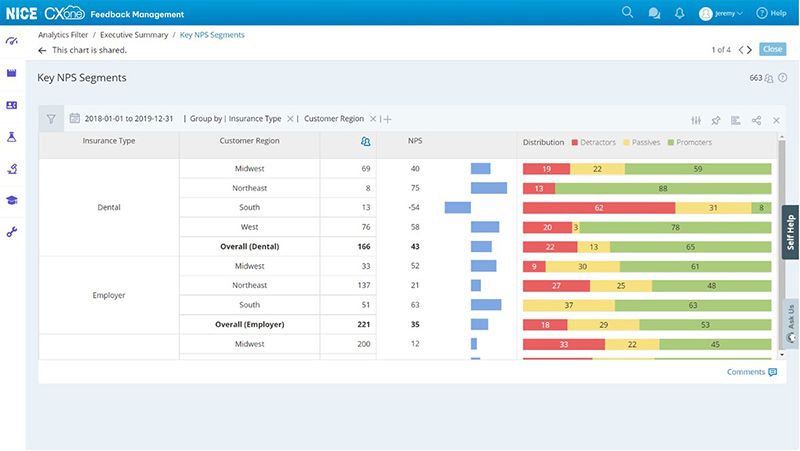
By combining operational data with NPS derived from direct feedback, the team was able to deliver this dashboard that the insurance company’s regional teams can use to quickly see whether various segments of customers in their area are promoters or detractors.
With this information, managers share ideas to fine-tune their customer service approaches to lift NPS and CX across the company.
Use case: Contact center agent ratings
The CX that your frontline contact center agents deliver can make or break your business, as NPS, loyalty, churn, and ACV all tie back to how customers feel about the service they receive.
How high are the stakes? 84% of consumers are very likely to switch companies after just one bad customer service experience. That churn can cost your company tens of millions of dollars, or more, in lost revenue. On the other hand, 87% of consumers said that they would buy more if they receive exceptional customer service.
In this example, the NICE Experience Consulting team helped a contact center leader analyze employee performance and results based on direct and indirect feedback data from CXone.
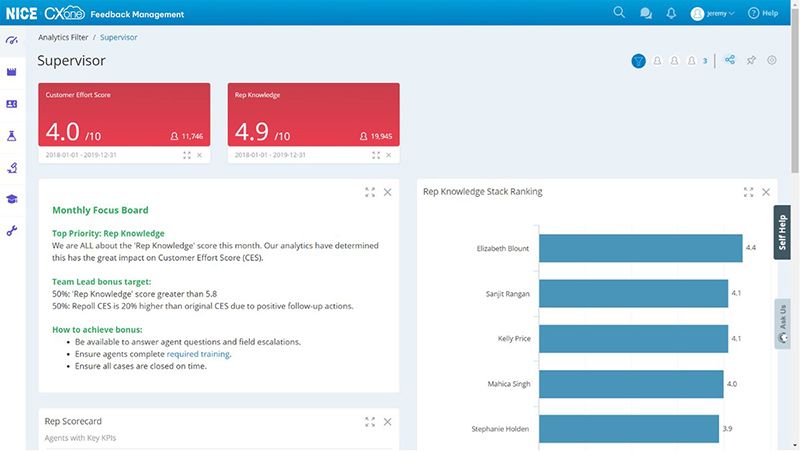
The analytics determined that rep knowledge scores had a great impact on customer effort scores (CES). The company was able to stack rank agents to provide transparency, and then focus the team on specific monthly priorities and objectives that would help them achieve their bonus.
Focus on fixing the right things
If you’re committed to improving your contact center performance and providing customers with frictionless experiences, start gathering the operational metrics that provide valuable context to your VOC surveys and other direct customer feedback. You’ll find that a holistic approach to data analysis will deliver deeper insights and a more complete, nuanced view of CX that helps you uncover root causes and focus on fixing the right things.

Download this quantitative research report from Aberdeen to learn how infusing VOC insights into your CX strategy can help you increase customer retention and drive operational efficiency.